Note
- Using GitHub Codespaces with JetBrains IDEs is currently in public preview and is subject to change.
- To work on a codespace in a JetBrains IDE you must use release 2023.3.* or 2024.1.* of the JetBrains Gateway.
Troubleshooting the Visual Studio Code web client
If you encounter issues using GitHub Codespaces in a browser that is not Chromium-based, try switching to a Chromium-based browser, such as Google Chrome or Microsoft Edge. Alternatively, check for known issues with your browser in the microsoft/vscode repository by searching for issues labeled with the name of your browser, such as firefox or safari.
If you encounter issues using GitHub Codespaces in a Chromium-based browser, you can check if you're experiencing another known issue with VS Code in the microsoft/vscode repository.
Differences from working in VS Code locally
When you open a codespace in your browser, using the VS Code web client, you will notice some differences from working in a local workspace in the VS Code desktop application. For example, some key bindings will be different or missing, and some extensions may behave differently. For a summary, see: "Known limitations and adaptions" in the VS Code docs.
You can check for known issues and log new issues with the VS Code experience in the microsoft/vscode repository.
Visual Studio Code Insiders
Visual Studio Code Insiders is the most frequent release of VS Code. It has all the latest features and bug fixes, but may also occasionally contain new issues that result in a broken build.
If you are using an Insiders build and notice broken behavior, we recommend switching to Visual Studio Code Stable and trying again.
Click in the bottom left of the editor and select Switch to Stable Version.... If the VS Code web client doesn't load, or isn't available, you can force switching to Visual Studio Code Stable by appending ?vscodeChannel=stable to your codespace URL and loading the codespace at that URL.
If the problem isn't fixed in Visual Studio Code Stable, check for known issues and, if required, log a new issue with the VS Code experience, in the microsoft/vscode repository.
Troubleshooting the Simple Browser
When you have started a web application in a codespace, you can preview the running application in the Simple Browser embedded in VS Code. In some projects, the application automatically opens in a Simple Browser tab in the editor when the application starts. This happens if, in the devcontainer.json configuration file for the codespace, the onAutoForward property of the port the application runs on is set to openPreview.
"portsAttributes": {
  "3000": {
    "label": "Application",
    "onAutoForward": "openPreview"
  }
}
If the Simple Browser tab does not open automatically, you can open the Simple Browser manually to view the application.
-
In VS Code, click the Ports tab.
-
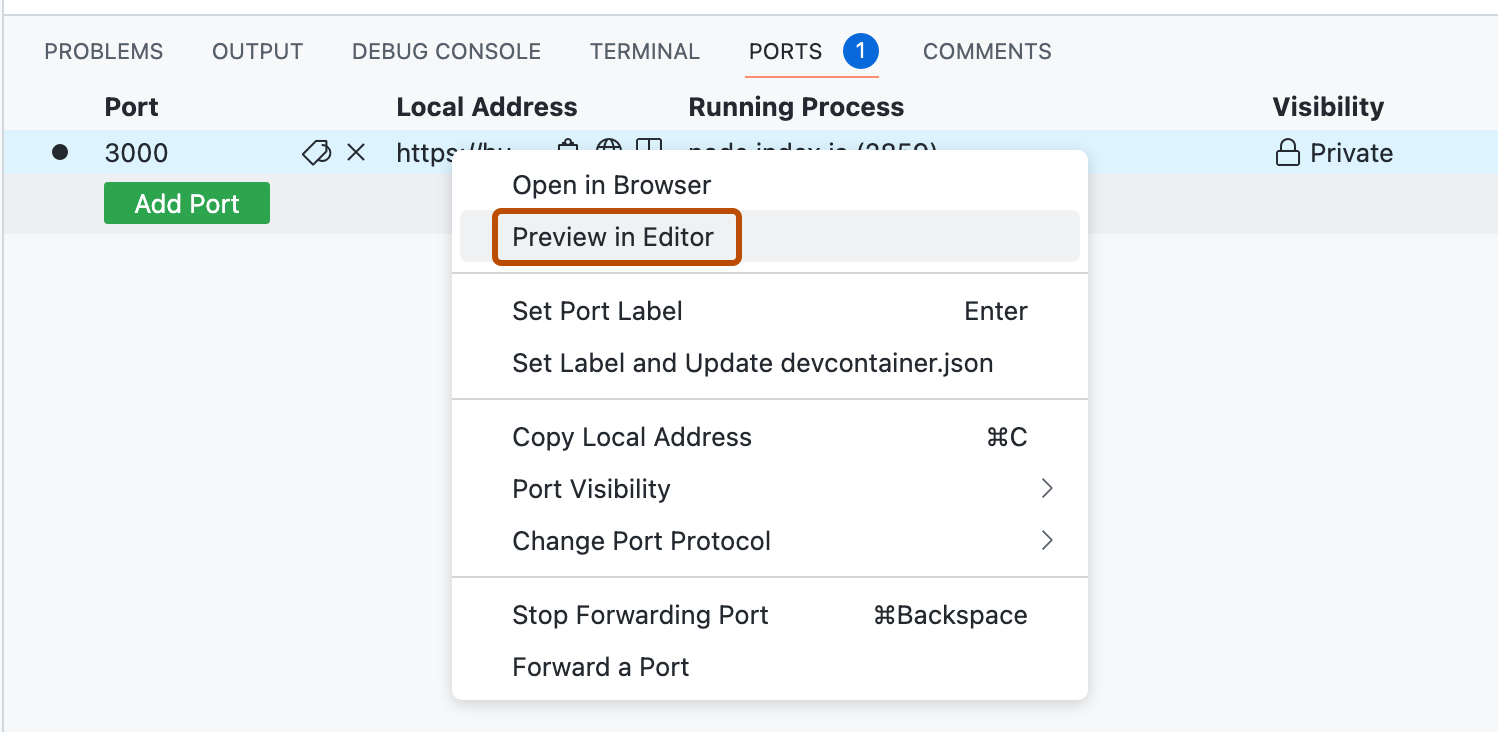
Right-click the port, then click Preview in Editor.
The simple browser tab does not open automatically
If the devcontainer.json configuration file specifies "onAutoForward": "openPreview" for a port, but the Simple Browser does not open automatically when an application starts, check that the application has started on the port specified in the configuration. The application might start on a different port if the intended port is busy.
To implement the port configuration specified in devcontainer.json, GitHub Codespaces writes the configuration to VS Code's settings.json file when a codespace is created. You can check that the configuration has been correctly written to settings.json in your codespace.
-
In the terminal in your codespace, enter the following command.
Bash cat ~/.vscode-remote/data/Machine/settings.json
cat ~/.vscode-remote/data/Machine/settings.json -
Verify that the
settings.jsonfile contains lines like the following."remote.portsAttributes": { "3000": { "label": "Application", "onAutoForward": "openPreview" } }
If the settings.json file doesn't contain these settings, check whether you have dotfiles enabled, and whether any configuration in your dotfiles is overwriting the settings.json file. For more information, see "Personalizing GitHub Codespaces for your account."
The application does not load
Occasionally, you may find that the Simple Browser tab opens, but displays an error page icon or a blank page instead of your running application. This can happen if the web application you are loading includes a content security policy (CSP) that restricts the domains in which the site's pages may be embedded. For more information, see CSP: frame-ancestors on the mdn website.
You may be able to change your application's frame-ancestors security policy locally to make the application display in the Simple Browser. Alternatively, if a frame-ancestors policy is causing the problem, you should be able to view the application by opening it in a regular browser tab rather than the simple browser. To do this, click the Ports tab in VS Code, right-click the port, and click Open in Browser.
VS Code troubleshooting
When you open a codespace in the VS Code desktop application, you may notice a few differences compared with working in a local workspace, but the experience should be similar.
If you encounter problems, you can check for known issues and log new issues with the VS Code experience in the microsoft/vscode repository.
Visual Studio Code Insiders
Visual Studio Code Insiders is the most frequent release of VS Code. It has all the latest features and bug fixes, but may also occasionally contain new issues that result in a broken build.
If you are using an Insiders build and notice broken behavior, we recommend switching to Visual Studio Code Stable and trying again.
To switch to Visual Studio Code Stable, close the Visual Studio Code Insiders application, open the Visual Studio Code Stable application, and re-open your codespace.
If the problem isn't fixed in Visual Studio Code Stable, check for known issues and, if required, log a new issue with the VS Code experience, in the microsoft/vscode repository.
Troubleshooting the Simple Browser
When you have started a web application in a codespace, you can preview the running application in the Simple Browser embedded in VS Code. In some projects, the application automatically opens in a Simple Browser tab in the editor when the application starts. This happens if, in the devcontainer.json configuration file for the codespace, the onAutoForward property of the port the application runs on is set to openPreview.
"portsAttributes": {
  "3000": {
    "label": "Application",
    "onAutoForward": "openPreview"
  }
}
If the Simple Browser tab does not open automatically, you can open the Simple Browser manually to view the application.
-
In VS Code, click the Ports tab.
-
Right-click the port, then click Preview in Editor.

The simple browser tab does not open automatically
If the devcontainer.json configuration file specifies "onAutoForward": "openPreview" for a port, but the Simple Browser does not open automatically when an application starts, check that the application has started on the port specified in the configuration. The application might start on a different port if the intended port is busy.
To implement the port configuration specified in devcontainer.json, GitHub Codespaces writes the configuration to VS Code's settings.json file when a codespace is created. You can check that the configuration has been correctly written to settings.json in your codespace.
-
In the terminal in your codespace, enter the following command.
Bash cat ~/.vscode-remote/data/Machine/settings.json
cat ~/.vscode-remote/data/Machine/settings.json -
Verify that the
settings.jsonfile contains lines like the following."remote.portsAttributes": { "3000": { "label": "Application", "onAutoForward": "openPreview" } }
If the settings.json file doesn't contain these settings, check whether you have dotfiles enabled, and whether any configuration in your dotfiles is overwriting the settings.json file. For more information, see "Personalizing GitHub Codespaces for your account."
The application does not load
Occasionally, you may find that the Simple Browser tab opens, but displays an error page icon or a blank page instead of your running application. This can happen if the web application you are loading includes a content security policy (CSP) that restricts the domains in which the site's pages may be embedded. For more information, see CSP: frame-ancestors on the mdn website.
You may be able to change your application's frame-ancestors security policy locally to make the application display in the Simple Browser. Alternatively, if a frame-ancestors policy is causing the problem, you should be able to view the application by opening it in a regular browser tab rather than the simple browser. To do this, click the Ports tab in VS Code, right-click the port, and click Open in Browser.
Troubleshooting JetBrains IDEs
Performance issues
A GitHub Codespaces machine type with at least 4 cores is recommended for running any of the JetBrains IDEs. For more information, see "Changing the machine type for your codespace."
If you are using a machine with 4 or more cores and the performance you are experiencing in JetBrains feels a little sluggish, you may need to increase the maximum Java heap size.
The recommended heap size varies according to the machine type of your codespace.
| Machine type | Maximum heap size |
|---|---|
| 4 core, 16 GB RAM | 2048 MiB |
| 8 core, 32 GB RAM | 4096 MiB |
| 16 cores, 64 GB RAM | 8192 MiB |
| 32 cores, 128 GB RAM | 16,384 MiB |
If the heap size is below the recommended value, a message is displayed when your codespace starts, suggesting that you increase the heap size. You can click the link in the message to increase the heap size automatically.

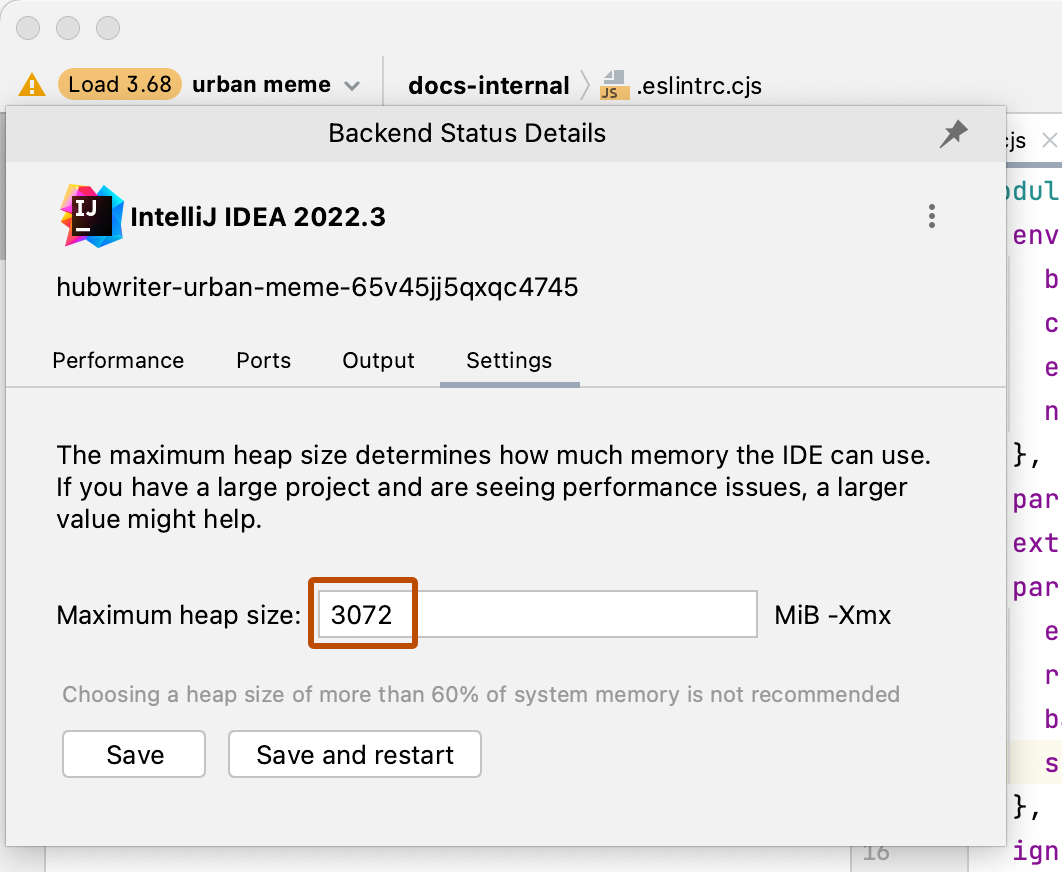
Depending on the size of your codebase, and the memory needed to run your application, you may need to increase the heap size further. You should set the heap size to somewhere between the size shown in the table above and 60% of the remote host's RAM. If you have a large application, you should not set too large a heap size, so that you allow the application adequate memory.
-
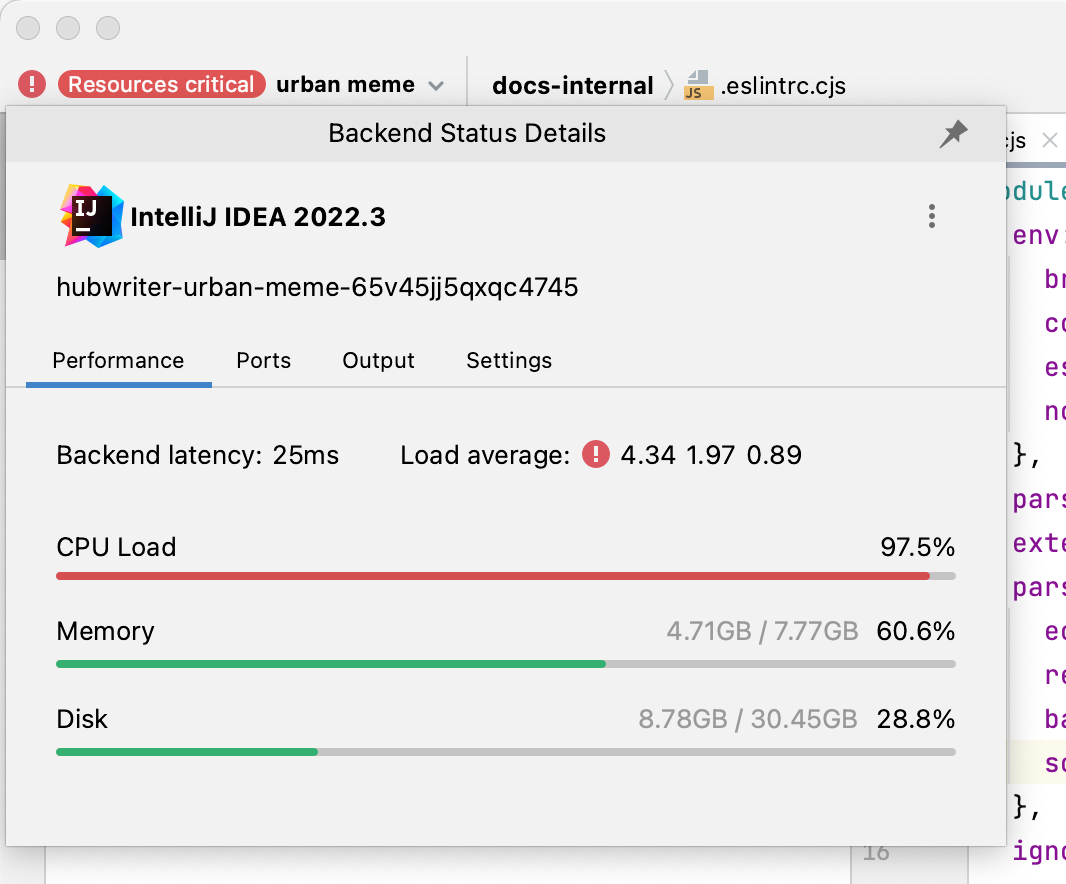
On the left of the navigation bar, at the top of the application window, click the name of the codespace.

-
In the Performance tab, note the CPU Load and Memory details. These will indicate whether the machine is overloaded.
-
Click the Settings tab and edit the heap size, increasing it to no more than 60% of the available memory for your codespace.
-
Click Save and restart.
Client can't be opened in macOS Ventura
In macOS Ventura, using versions of the JetBrains Gateway prior to version 2022.3, the first time you try to connect to a codespace from the JetBrains Gateway a message was displayed telling you that the JetBrains client application "is damaged and can't be opened."
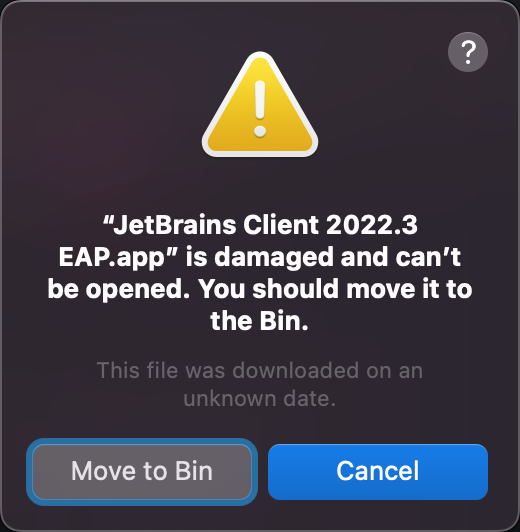
This issue is fixed in the JetBrains Gateway, version 2022.3 and later.
To avoid this issue, update the JetBrains Gateway.
To work around this problem with older versions of the Gateway:
-
Click Cancel to dismiss this message.
-
Click the Apple icon, top left of the screen, and click System Settings.
-
Click Privacy & Security and scroll down to the "Security" section.
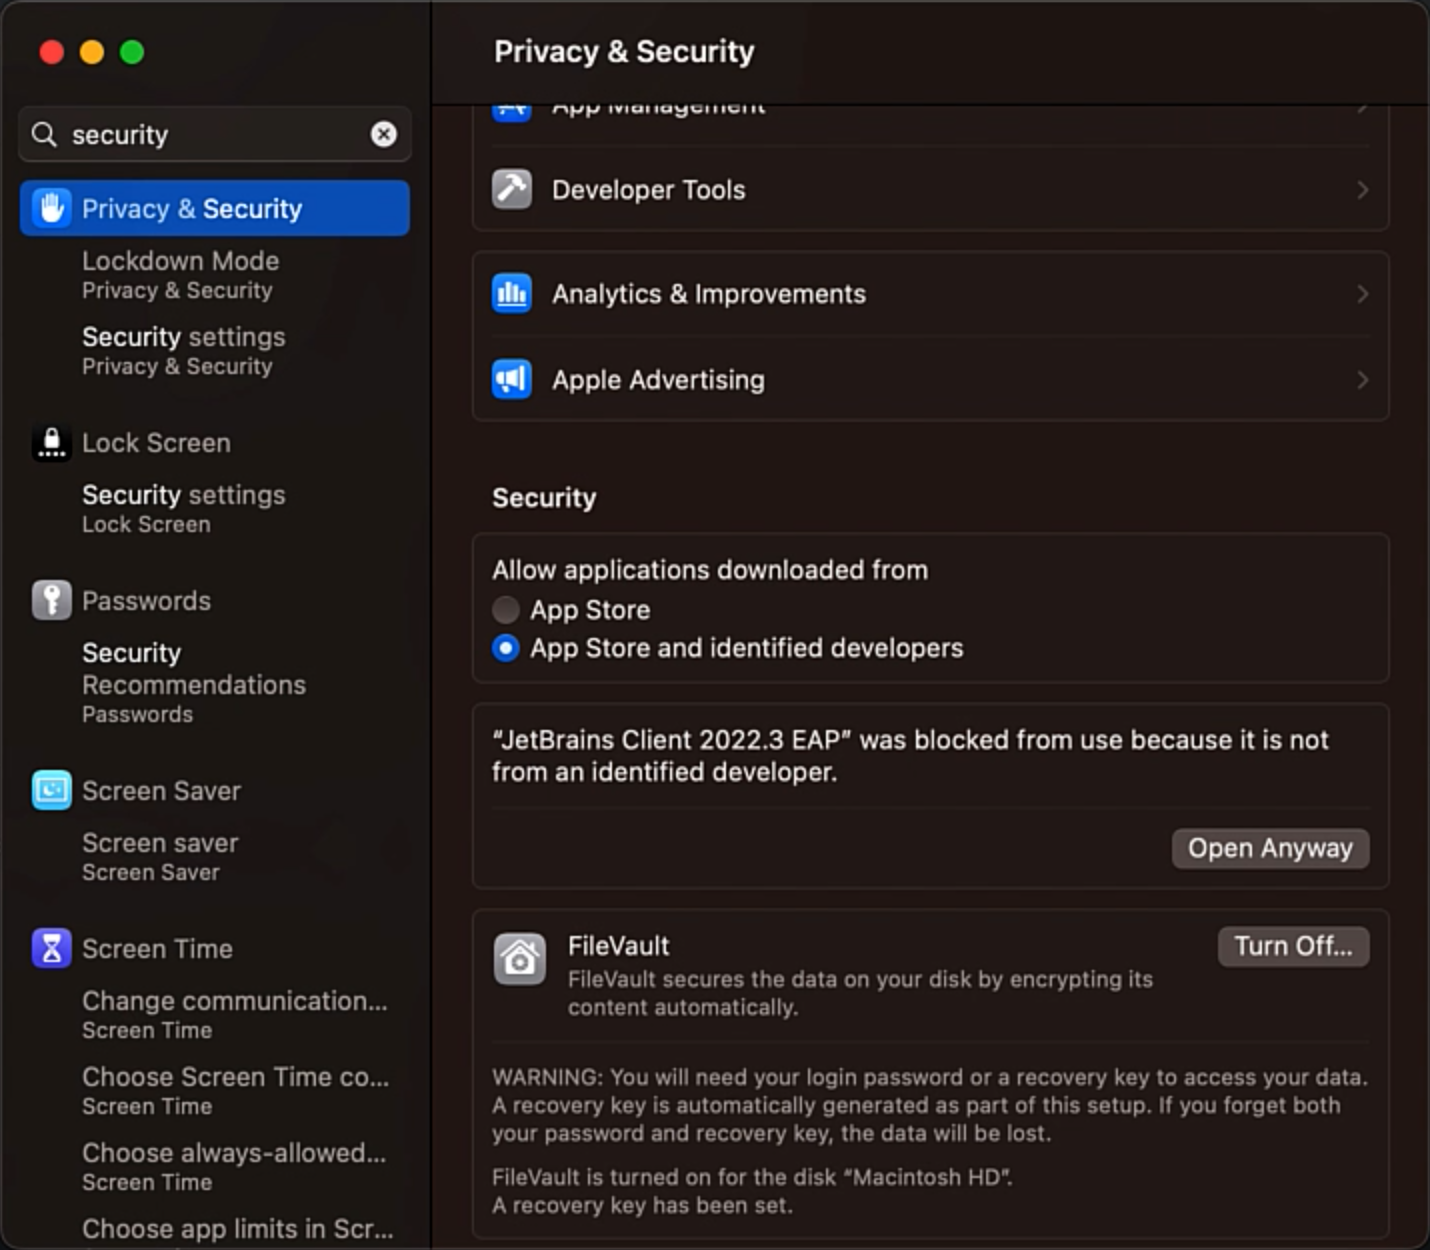
You will see a message telling you that the JetBrains Client was blocked from use.
-
Click Open Anyway to add the JetBrains client to your recognized applications. The message is displayed again but this time with an Open button.
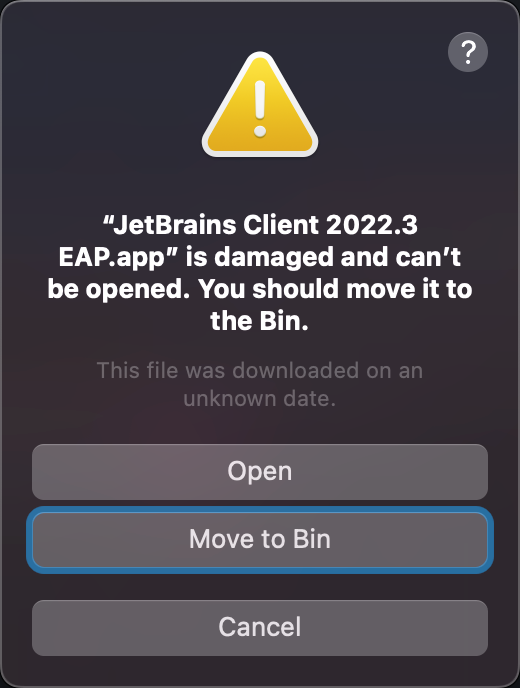
-
Click Cancel again.
-
Go back to the JetBrains Gateway application and connect to the required codespace again. The JetBrains client will now open successfully. Having authorized the client application to run on your Mac, you will not see the message when you connect to your codespaces in future.
SSH connection issues
To connect via the SSH server running in your codespace, you must have an SSH key in your ~/.ssh directory (macOS and Linux) or %HOMEPATH%\.ssh directory (Windows) that has already been added to your GitHub account. If you do not have any keys in this directory, GitHub CLI will generate keys for you. For more information, see "Adding a new SSH key to your GitHub account."
If you encounter problems with key validation, try upgrading your version of GitHub CLI. For information, see the upgrade instructions in the README for GitHub CLI.
JetBrains IDE issues
For help with issues specific to the JetBrains IDE you are using, or the JetBrains Gateway application, see Product Support on the JetBrains website.