Note
- Using GitHub Codespaces with JetBrains IDEs is currently in public preview and is subject to change.
- To work on a codespace in a JetBrains IDE you must use release 2023.3.* or 2024.1.* of the JetBrains Gateway.
Information on GitHub Codespaces is output to various logs:
- Codespace logs
- Creation logs
- Browser console logs (for the VS Code web client)
Extension logs are available if you are using GitHub Codespaces in VS Code. Click the "Visual Studio Code" tab above for details.
- Codespace logs
- Creation logs
- Extension logs (for the VS Code desktop application)
Browser logs are available if you are using GitHub Codespaces in your browser. Click the "Web browser" tab above for details.
- Codespace logs
- Creation logs
Other logs are available if you are using GitHub Codespaces in VS Code or in your web browser. Click the tabs above for details.
- Creation logs
Other logs are available if you are using GitHub Codespaces in VS Code or in your web browser. Click the tabs above for details.
Codespace logs
These logs contain detailed information about the codespace, the container, the session, and the VS Code environment. They are useful for diagnosing connection issues and other unexpected behavior. For example, the codespace freezes but the "Reload Windows" option unfreezes it for a few minutes, or you are randomly disconnected from the codespace but able to reconnect immediately.
- If you are using GitHub Codespaces in the browser, ensure that you are connected to the codespace you want to debug.
- Open the VS Code Command Palette (Shift+Command+P (Mac) / Ctrl+Shift+P (Windows/Linux)) and type
export logs. Select Codespaces: Export Logs from the list to download the logs. - Define where to save the zip archive of logs then click Save (desktop) or click OK (web).
- If you are using GitHub Codespaces in the browser, right-click on the zip archive of logs from the Explorer view and select Download… to download them to your local machine.
Codespace logs
These logs contain detailed information about the codespace, the container, the session, and the VS Code environment. They are useful for diagnosing connection issues and other unexpected behavior. For example, the codespace freezes but the "Reload Windows" option unfreezes it for a few minutes, or you are randomly disconnected from the codespace but able to reconnect immediately.
- Open the VS Code Command Palette (Shift+Command+P (Mac) / Ctrl+Shift+P (Windows/Linux)) and type
export log. Select Codespaces: Export Logs from the list to download the logs. - Define where to save the zip archive of logs then click Save (desktop) or click OK (web).
Codespace logs
These logs contain detailed information about the codespace, the container, the session, and the VS Code environment. They are useful for diagnosing connection issues and other unexpected behavior. For example, the codespace freezes but the "Reload Windows" option unfreezes it for a few minutes, or you are randomly disconnected from the codespace but able to reconnect immediately.
Currently you can't use GitHub CLI to access these logs. To access them, open your codespace in VS Code or in a browser.
Creation logs
These logs contain information about the container, dev container, and their configuration. They are useful for debugging configuration and setup problems.
- Connect to the codespace you want to debug.
- Open the VS Code Command Palette (Shift+Command+P (Mac) / Ctrl+Shift+P (Windows/Linux)) and type
creation log. Select Codespaces: View Creation Log from the list to open thecreation.logfile.
If you want to share the log with support, you can copy the text from the creation log into a text editor and save the file locally.
Open the VS Code Command Palette (Shift+Command+P (Mac) / Ctrl+Shift+P (Windows/Linux)) and type creation log. Select Codespaces: View Creation Log from the list to open the creation.log file.
If you want to share the log with support, you can copy the text from the creation log into a text editor and save the file locally.
To learn more about GitHub CLI, see "About GitHub CLI."
To see the creation log use the gh codespace logs subcommand. After entering the command choose from the list of codespaces that's displayed.
gh codespace logs
For more information about this command, see the GitHub CLI manual.
If you want to share the log with support, you can save the output to a file:
gh codespace logs -c <CODESPACE-NAME> > /path/to/logs.txt
Extension logs
These logs are available for VS Code desktop users only. They are useful if it seems like the GitHub Codespaces extension or VS Code editor are having issues that prevent creation or connection.
- In VS Code, open the Command Palette.
- Type
logsand select Developer: Open Extension Logs Folder. - Your system's file explorer is displayed showing various log files and folders. Open the folder
output_logging_DATETIME.
From this view, you can access logs generated by extensions you use in VS Code, including GitHub Codespaces.
Browser console logs
These logs are useful only if you want to debug problems with using GitHub Codespaces in the browser. They are useful for debugging problems creating and connecting to GitHub Codespaces.
The following instructions are for Chrome. The steps for other browsers are similar.
-
In the browser window for the codespace you want to debug, open the developer tools window.
-
Click the Console tab.
-
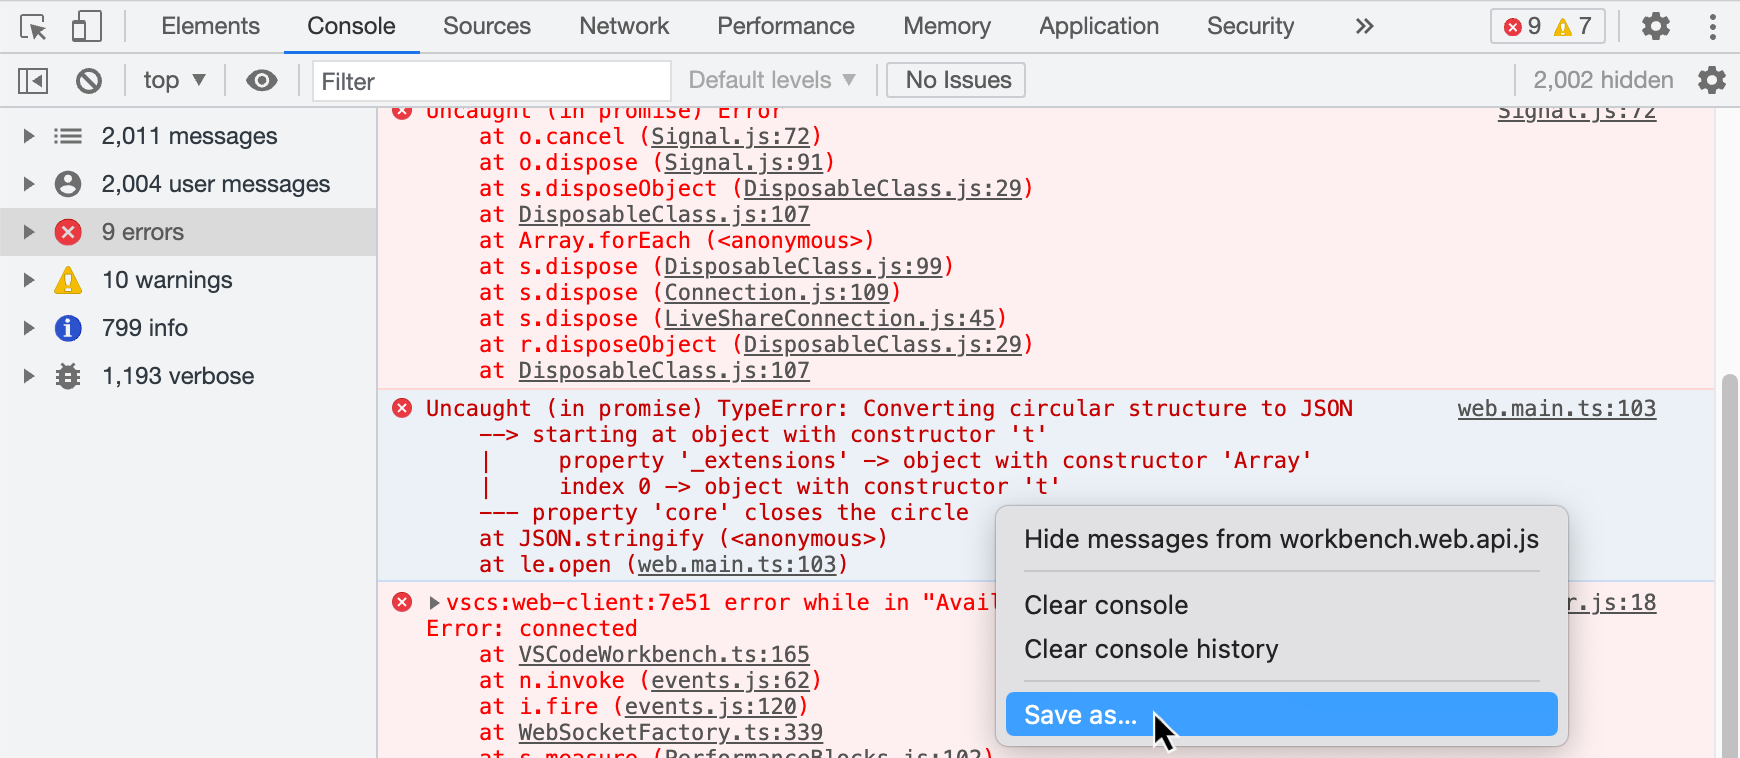
Show the console sidebar, if it is not already displayed. For more information, see "Console features reference" in the Chrome for Developers documentation.
-
In the sidebar, click NUMBER errors to show only the errors.
-
In the log area on the right, right-click and select Save as to save a copy of the errors to your local machine.

-
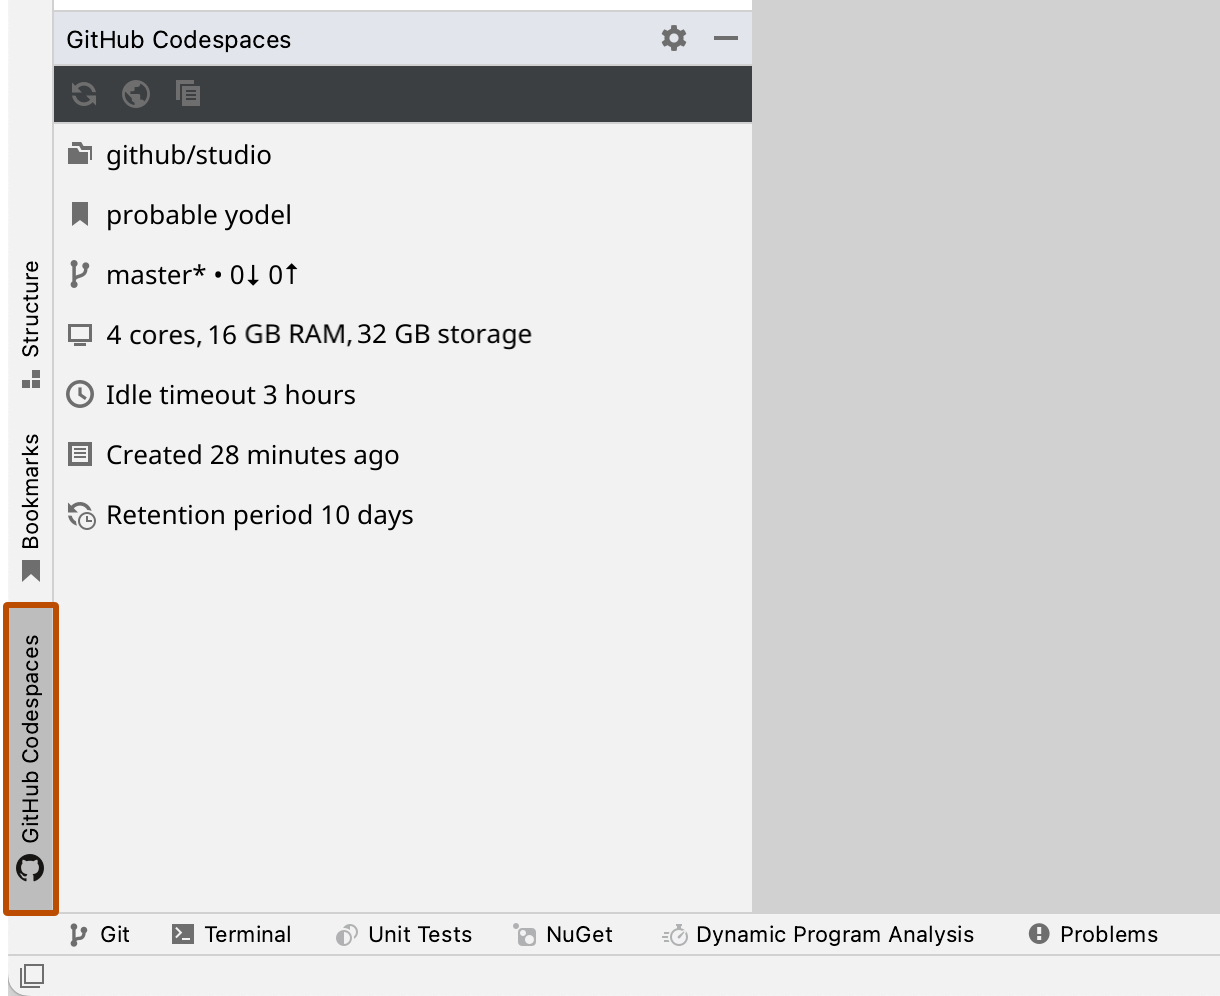
In the JetBrains client, click the GitHub Codespaces plugin to display the GitHub Codespaces tool window.

-
In the GitHub Codespaces tool window, click the log icon.

JetBrains logs
You can download logs for the remote JetBrains IDE and the local client application by going to the Help menu in the JetBrains client application and clicking Collect Host and Client Logs.